 Critics of the global warming concept tend to come in two broad varieties. One category includes those who, for whatever reasons, simply refuse to accept the idea in any form (and which has a common sub-variant: the "global warming is not real, it has nothing to do with humans, there's nothing we can do about it, and anything we can do about it would be too expensive" complaint). The other category of critic, however, is more reasonable -- it consists of people who are cautious about the idea, wishing to see more scientific research before coming to any conclusion. While this sometimes is just a cover story for the first type of critic, there are many people out there who have understandable concerns about just how scientists know what they claim to know about climate disruption.
Although we've pointed in the past to non-specialist-level explanations of global warming and climate change as well as to specific studies and models, we haven't had a good resource for a comprehensive and detailed explanation of how we came to understand the threat of global warming-induced climate change -- until now.
WorldChanging friend and ally Arthur P. Smith alerted us to an amazing site at the American Institute of Physics entitled "The Discovery of Global Warming." The Discovery of Global Warming site encompasses the full text of the 2003 book of the same name by physicist Spencer Weart, as well as an abundance of additional graphs, documents, and -- best of all -- hyperlinks between the various concepts explained in the text. You can even grab an archive of the entire site as a Zip file, as PDF documents, and even as a CD-ROM.
The site -- all 250,000 words of it -- surveys the breadth and depth of research over the years into climate change and global warming. Although current as of mid-2003, this is not simply a summary of the most recent findings. Weart spends a good bit of effort covering the history of how scientists have come to understand how the climate works, providing valuable insights into the process of science itself. Even if you don't get a chance to browse the rest of the site, I strongly recommend that you read the essay "Reflections on the Scientific Process, as Seen in Climate Studies" -- it's one of the best examinations of the scientific method in the real world I've read in a long time.
If you already accept the global climatological consensus that anthropogenic global warming is happening and is getting worse, The Discovery of Global Warming will provide abundant detail to help you better understand how that consensus came about. If you have been honestly skeptical about the global warming threat, but willing to listen, this site will help you better understand why there is a broad scientific consensus about climate disruption in the first place. It may not change your mind, but you'll see why so many scientists take the problem so very seriously.
(And, yes, I shut comments off for this post. Entries about global warming always seem to trigger tediously atavistic aggression-dominance displays and namecalling by certain first category climate change critics who inexplicably read this site, and I don't feel like playing comment moderator tonight. If you want to comment on the post, please feel free to send me an email or a trackback ping from your own blog.)
 If you want to get a sense of what's going on inside of your body, you can -- if you have the money or an extremely generous insurance provider -- get a full body scan, using various devices to get detailed cross-sections of your body, a process known as "tomography." But what if you want to get a sense of what's going on inside the Earth? Well, guess what.
 Hey, USians -- do you know just how many pollutants, toxic wastes, and environmental hazards are in your neighborhood? You do now. The eco-organization
  Geobacter sulfurreducens -- get used to seeing that name. It may well be the key to cleaning up some of the most dangerous radioactive wastes sites around. Best of all, it's completely natural.
 Like it or not, the Kyoto treaty on climate change is pretty much dead. The U.S. has flatly rejected it; Russia is


 Sometimes, the sites we find for WorldChanging just make us sit back with a big grin and say, "wow."
 The
The 
 Is density a key metric for determining how livable a city is? It's a possibility. The Kennedy School's
  WorldChanging ally
  The
The  Disease outbreaks don't just arise out of nowhere. Environmental conditions have to be just right for disease-causing viruses and bacteria to flourish. This suggests a possible strategy for dealing with pathogen outbreaks: watch for signs that the environmental conditions conducive to disease are emerging, then move to protect the threatened populations.
 WorldChanging ally Roel Groeneveld
  A pair of companies in Arizona are about to
  Almost lost amidst the (justifiable) outrage and attention regarding the Iraqi prisoner abuses is news that a team at the University of Washington has knocked down the last scientific objection to the notion that global warming is real, and that human activity is a significant causal factor.
 We're now in the seventh year of drought in much of North America, and there are few signs that the situation will be changing any time soon. Across the American West, the snow pack -- the source of water through the summer months -- was only 40-75% of normal. Of course, "normal" may have been a historical aberration...
 Understanding is the first step to action.
 The GLACSWEB project is a test for expanded use of these probelet networks for ecosystem study, such as coastal and flood monitoring. The sensors are small and cheap enough for easy distribution, but smart enough to be able to respond to changing conditions (such as probes going offline or being moved). The GLACSWEB program isn't the only environmental sensor project around; we've
  The National Campaign Against Dirty Power has an
  Climatologists have long used ice core samples from Greenland to measure climate changes over the last hundred thousand years or so. But according to the
  What would a positive environmental scenario for China look like? We've talked a bit here about the
  The National Center for Atmospheric Research, funded by the National Science Foundtaion,
  When one thinks of the city of Los Angeles, "environmentalism" doesn't immediately come to mind. LA is infamous for its suburban sprawl, automobile culture, and seemingly-constant layer of smog. But this doesn't mean that LA isn't trying to change. The
 Today's
 What would you do if you discovered that something you had designed could kill thousands of people?
 One of the more reliable tropes of classic cyberpunk literature was the use of shipping containers as residences. Neal Stephenson used it in one of his novels, and William Gibson used it twice -- once in a novel, and again in a script he wrote for The X-Files. In cyberpunk lore, the shipping-container-cum-home was emblematic of both the "street finds it own uses for things" attitude and the life on the edge situation of the characters. As with many science fiction ideas, reality eventually caught up with the writers' imaginations, but perhaps not in the way they had anticipated.
 Scientists at NASA's Goddard Space Flight Center may have
 We may be able to cross one potential disaster off the list (but do it in pencil).
 Naturalist David Bellamy
  The
The 
 The European Space Agency has been involved in
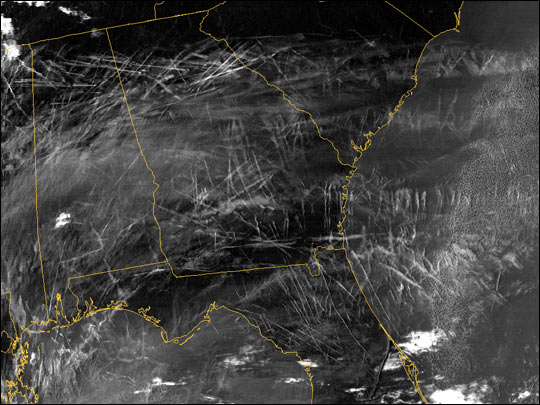
 Satellites are able to take the measure of our planet in ways that are essentially impossible from the ground. Both
  It's almost as if

 All models of reality make assumptions about reality. The
  WorldChanging reader John Atkinson alerts us to an article in the current issue of the Proceedings of the National Academy of Sciences entitled "
 The Grand Canyon, no matter how much a work of natural beauty it appears, shows numerous signs of human handiwork. Perhaps the most subtle is the gradual loss of sandbanks resulting from the 1963 construction of the Geln Canyon dam upstream. Along with controlling water flow, the dam traps the sediments which had, for millennia, filtered through the canyon, creating sandy habitats for land and river life alike. As a result, four out of eight fish native to the Grand Canyon have died out, and a fifth extinction looks likely soon.

 Why are we so concerned with the
  Since
Since  How many species are left on Earth -- and how would you know if you've stumbled across a new one?
 While we can often be found extolling the virtues of South-South science, it's good to see a bit of North-South science in the mix, too.
  It's almost time to put a moratorium on WorldChanging stories pointing to yet more research showing that global warming is happening and is caused by human activity. Opposition to the idea at this point is entirely political, not scientific, and while the added data points are undoubtedly useful to researchers, such stories tend to run together. Our focus now should be on doing something about the problem. That said, the latest "it's happening" story, coming from this week's

 For many of us, cities are the most tangible example of slow change. Buildings rise and fall, streets and wires unfurl, but at a pace which is simultaneously gradual enough to be almost invisible to our day-to-day wanderings, and still fast enough to be shockingly evident within the space of our lifetimes. That's what makes
  Phytoplankton -- microscopic plant forms floating in the oceans -- are the closest thing on the planet to the underlying fuel for life. Phytoplankton are at the base of the marine food chain, and produce around half of the oxygen in our atmosphere. We know that they bloom and are consumed quickly; phytoplankton have an annual production comparable to all terrestrial plants on Earth. Up until now, however, nobody had figured out a way to determine precise phytoplankton growth rates.
 This week's Nature also includes an outstanding editorial by Keith Alverson, "
 How do you know when an ecosystem is dying? Discovering species on the edge of extinction -- or already past the edge -- doesn't always give the bigger picture. Changes to a region will affect different species in different ways, letting some flourish even as others die.
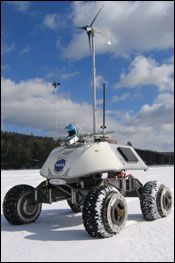 Carnegie-Mellon's sensor-laden Nomad robotic explorer, which traveled 135 kilometers across Chile's Atacama desert in 1997, is set to take on a new adventure. It's going to be


 If you even come close to the sustainable blogosphere (as I increasingly see it called) today, you know that the UN's
  The
The  UC Berkeley Physicist
  What does "sustainability" mean? The question is harder than it first appears. It's
  As long-time readers of WorldChanging know, I am especially enthusiastic about the use of space-based tools for watching and understanding geophysical and environmental systems. Big-picture views of the world can capture subtle interactions across large areas, as can the use of sensors picking up signals outside of the visible light spectrum. These are not replacements for ground observation, but important supplements.
 How will global warming-induced climate disruption affect your hometown?
 I managed to get ahold of the
  Someday, we'll be able to predict the onset of a major earthquake with the same relative accuracy as weather forecasts -- not perfect, but definitely useful days or sometimes a week or more in advance. Someday, but not today.
 "Peak oil" -- the notion that global production of oil will soon reach its maximum, and will subsequently decline (even while demand continues to rise) -- is getting quite a bit of attention lately. It's not surprising; peak oil is a useful metaphor for the broader problem of not paying attention to longer-term problems, as well as an implicit driver for a move away from fossil fuels. If global warming isn't reason enough, the argument goes, and if sending money to corrupt and unstable nations isn't reason enough, running out of oil is.
 SEA-LABS -- Sensor Exploration Apparatus utilizing Low-power Aquatic Broadcasting System -- may be a bit of an acronymic stretch, but the idea underlying the jargon is rather exciting.
  Hurricane season is now underway (and if you live in a hurricane-prone area, or simply want to follow the season in detail, don't forget about the
  We
We  Not a spy thriller, the Kaya Identity is the formula which projects the amount of atmospheric CO2 as a function of population, GDP per capita, watts per dollar, and CO2 per watt. It's pretty straightforward: our carbon output depends on how much power we use, how efficiently we use it, and how "dirty" the production is. Recall that current atmospheric carbon dioxide levels are just under 380 parts per million, and that the general consensus among climatologists is that (looking just at CO2), the climate is up for some serious problems once we hit the 440ppm level. With the Kaya Identity, we can calculate just what combination of factors would keep us below that level.
 It's hard to overestimate the importance of phytoplankton to the planet's global ecosystem. Plankton are pretty much the bottom of the food chain, and as their numbers rise and fall, so too do the fortunes of nearly every other creature of the sea. But it turns out that the oceans aren't the only part of the Earth with a fate dependent upon plankton -- they affect the atmosphere, too.
 NASA is set to test a new project they call the "
 Global climate models are pretty good -- better than some give them credit for -- but they're not perfect. There are still elements of atmospheric systems that they don't adequately cover. One such element is the effect of cities upon the climate. Arguably, this is not a disaster, as cities cover all of about 0.2 percent of the planet's land surface. But
  I
I  During a multi-hour delay at the airport for my return home yesterday, I picked up the newly-released paperback version of journalist Paul Roberts'
 We know that there's a strong correlation between urban density and energy efficiency. Communities packing 12 or more households per acre
  The so-called "de-militarized zone" between South Korea and North Korea (who are technically still at war) is devoid of any human habitation or activity, and has been for about 50 years. As a result, this space -- 250 kilometers long, 4 kilometers wide -- has become home to a staggering array of rare plants and animals, including the highly endangered red-crown crane. Bruce Sterling wrote about the DMZ as an "involuntary park" a
  Thirteen thousand years ago or so, North America was home to a variety of well-established species and one new one. The well-established species included relatives of modern elephants, lions, cheetahs and numerous other animals now found only in a few places in Africa and Asia; the new species was Homo sapiens. Unfortunately, when the new species met the old species, something had to give. Although paleontologists and archaeologists haven't pinpointed precisely why many of the North American megafauna died out, it looks highly like that humankind had no small role in their fate. These extinctions meant more than the disappearance of wild animals; they were massive disruptions to the continental ecosystem, the effects of which are still being felt.
 A bacteria known as SAR 11 -- or Pelagibacter ubique -- now has the distinction of being the living organism on Earth with the
  The demilitarized zone between North and South Korea wasn't the first "
 In the age of climate disruption, clear-eyed foresight is a necessity -- but hurricane Katrina was a reminder that foresight means more than imagining the worst and preparing for it.
  One of the results of the December tsunami was increased interest in the development of
 A common argument against the implementation of stricter pollution regulations (including greenhouse emission caps) is that they would exact too high a cost on the economy. Businesses and governments would have to lay out billions of dollars on retrofits and cleanups, the argument goes, slowing economic growth. A
  The
The  There's been a flurry of understandable
  Researchers and civic officials in Africa will soon have access to
 A
A 

 Reasonable people may disagree, but Princeton geology professor emeritus
  As most of you know, this year's Atlantic hurricane season, which just ended officially (even if the Atlantic hurricanes haven't noticed), was the most active on record. What you might not have heard, however, is that all National Weather Service predictions were for Epsilon to weaken instead of getting stronger. This year's hurricane season wasn't just stronger and more active than anyone expected, it was also weirder.
 Although
 Far too often, discussions of efforts to mitigate the worst effects of global warming bog down under an argument that is simultaneously factual and irrelevant: there's no single solution. Solar power (or wind, or nuclear, or sonofusion) is not going to be sufficient to replace all coal and oil use. Efficiency won't improve fast enough. Sequestration can't bury enough CO2. These are all true, but only in isolation. The solution that will work comes not as a single bolt from the blue, but from a combination of multiple, varied efforts.
 Space-based scientific research has an underappreciated role in building a better world. This week alone has three stories of important work being done from space on issues critical to WorldChanging.
 If global warming results in the
  About two years ago, we posted a brief piece on Lester Brown's book,
 UC Santa Barbara's Lars Hufnagel, along with Theo Geisel and Dirk Brockmann from the Max Planck Institute, have taken an Internet curiosity involving the travels of dollar bills and used it to create a
  We know that we're adding millions of tons of carbon into the atmosphere every year, with demonstrably negative results for the global climate. But precisely how the planetary ecosystem reacts to this additional carbon is dependent upon the details of the
  New articles on RealClimate and The Oil Drum provide useful insights into the state of our current understanding of the buildup of carbon dioxide in the atmosphere -- and what we need to do in order to forestall disaster.
 Here's an interesting first pass at an enviro mashup for Google Maps: the
  Duke University's
  2005 will be remembered for many reasons, but perhaps the most worldchanging is the explosion in online geographic information systems, led by Google Earth. We've covered
  These days, most spam-filtering programs rely on something called "
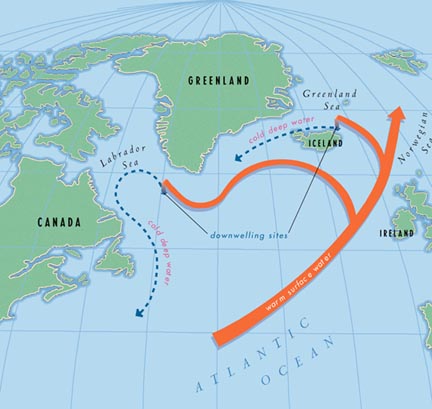
 For some people, global warming is a hard sell. Temperatures going up by a few degrees doesn't sound all that bad, and even results like drought or increased spread of mosquitos and other pests, while certainly unpleasant, are familiar issues. Mega-problems like whiplash/abrupt climate change, where warming leads to an ice age, can sound more surreal than threatening. But
  Even in the best case climate scenarios, the planet is going to face years of rising temperatures and some pretty unpleasant (and often tragic) results across much of the world. Given that many of the worst-hit locations will be in the poorer nations, it's important that we spend some time thinking about ways not just to mitigate the process of climate disruption -- that is, to reverse it -- but also to mitigate its effects. This isn't "adaptation," it's harm reduction; think of it as suppressing the worst symptoms while fighting to cure the disease.