 Google Earth is fast becoming a key tool for the monitoring of changes to our planet, via the use of online information layers -- the combination of networked data and Google maps are known as "mash-ups" (after the music genre). The latest mash-up is DAMOCLES, a project by the Technical University of Denmark to provide compelling and useful information on the effects of climate change on Arctic ice (unsurprisingly, the university has numerous projects related to arctic sea ice). DAMOCLES adds satellite and ground-level sensor data to Google Earth polar maps, providing daily-updated readings of ice motion and thickness.
DAMOCLES, a tortured acronym for "Developing Arctic Modelling and Observing Capabilities for Longterm Environmental Studies," seeks to reduce the uncertainties regarding the effect of global warming-induced climate disruption on the polar regions, with a current focus on the north pole. Climate scientists now recognize that global warming hits the poles much harder than the equatorial and temperate regions -- as much as 7 degrees Fahrenheit in the last 50 years -- with dramatic results. At the south pole, the warming threatens to break up the Antarctic ice sheet (if the entire Antarctic ice sheet melted, it would raise sea levels by at least 60 meters), while at the north pole, warming has already led to the disappearance of vast stretches of ice pack, eliminating areas once used by Inuit communities and threatening wildlife.
DAMOCLES uses satellite data from the ESA and NASA, as well as ice motion sensors deployed by Russia and the International Arctic Ocean Buoy Project.
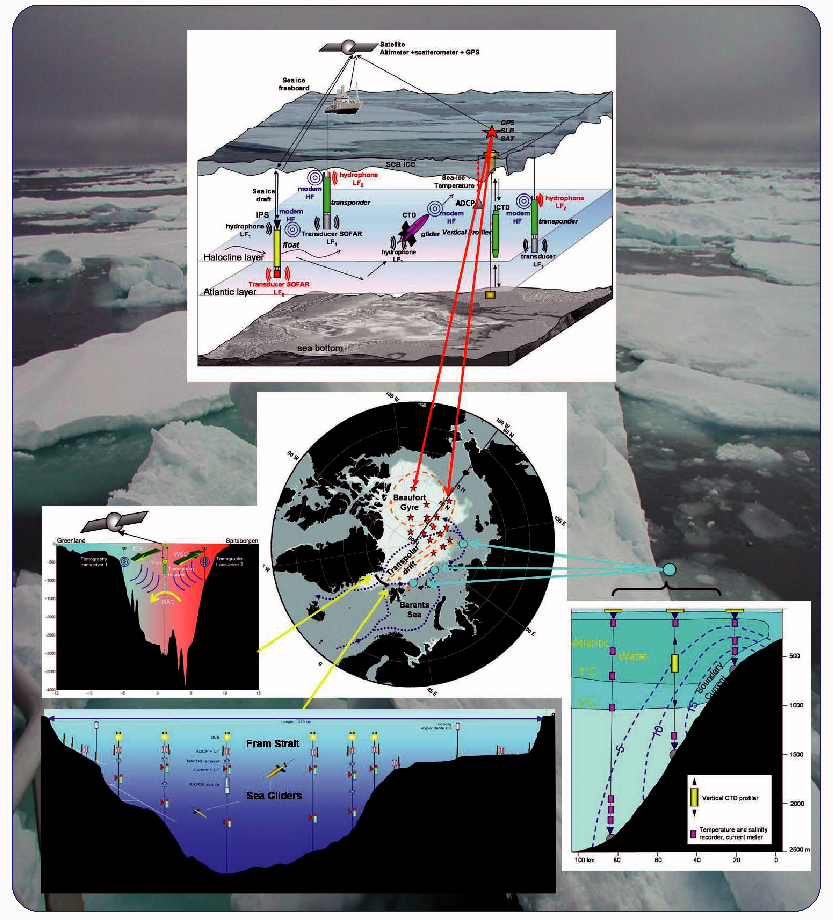
DAMOCLES is an integrated ice-atmosphere-ocean monitoring and forecasting system designed for observing, understanding and quantifying climate changes in the Arctic. An advanced observing system will be developed and deployed, providing for the first time, synoptic, continuous and long-term monitoring of the lower atmosphere, sea-ice and upper ocean. It is designed to evaluate and improve global and regional climate forecasting models based on validation, assimilation and integration of observed data. The ultimate goal will be to lengthen the lead-time of extreme climate changes predicted to occur in the Arctic within this century according to the Arctic Climate Impact Assessment (ACIA) and thus to improve the ability of society to mitigate for its impacts.
DAMOCLES results are available as daily image and data sets, as well as via a Java-based browser. Regional pictures from the south pole can also be found at the Seaice.dk website.
It's remarkable how quickly Google Earth mash-ups have become valuable scientific visualization tools. We mentioned Nature's avian flu mash-up recently, and like it, DAMOCLES is able to portray both current status and change over time in compelling and informative ways, giving geographic context to multiple data sources. Both the avian flu mash-up and the DAMOCLES mash-up require the free (but not FLOSS) Google Earth application, available for WindowsXP and MacOSX 10.4. It's not the same as the Google Maps website, although both rely upon the same satellite image sets.
(Via OgleEarth)
Comments (2)
WOW!!! My two obsessions mixed in one!! climate change and mash-ups!! not only that but now finally people can see how, while ice melts almost everywhere, there ARE some places (as you know) where the ice is growing... trhank heavens for DAMOCLES now we can actually see whats happening!!! thanks Jamais
Posted by lee | January 24, 2006 4:21 AM
Posted on January 24, 2006 04:21
For some related information on this story as it relates to Google Earth, including details on the Google Earth data for Antartica as well, see the Google Earth Blog entry:
http://www.gearthblog.com/blog/archives/2006/01/artic_and_antar.html
Posted by Frank Taylor | January 30, 2006 6:42 PM
Posted on January 30, 2006 18:42